8 March 2021 - Fourth Meeting
- Caitlyn LIMBERT
- Mar 22, 2021
- 1 min read


✤ Discussing balancing and reinforcing loops as well as stock and flow diagrams, we applied these tools to the waste management issue.
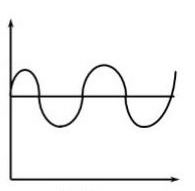

^graphs that represent the trends of balancing and reinforcing loops

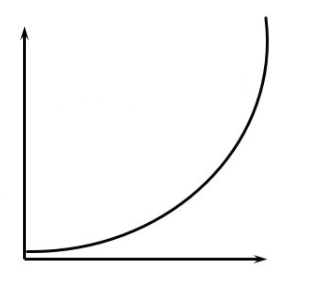
Balancing Loop: Balancing loops counter change in one direction with change in the opposite direction. Balancing processes attempt to bring things to a desired state and keep them there, much as a thermostat regulates the temperature in a house. For example, when we are hungry, our body sends a signal to our brain that it’s time to eat, which appeases the hunger.

Reinforcing Loop: In a reinforcing loop, change in one direction is compounded by more change. For example, money in a savings account generates interest, which increases the balance in the savings account and earns more interest.

Stock-and-flow diagrams consist of:
in flow (the arrow going into the stock)
stock
out flow (the arrow going out of the stock)
converters (factors that affect the inflow and outflow)

^an applied stock-and-flow diagram to the "Waste Issue in Indonesia"
A stock-and-flow diagram can be represented as a bathtub.
E.g. Carbon dioxide levels in the air ☟


Comments